
Fun with Microsoft azure machine learning #AzureML – scenario: weather prediction
In December I gave a rather entertaining lecture on Azure Machine Learning on the sepagoForum in Cologne: “Fun with Azure Machine Learning”. In addition to a brief introduction to neural networks and AzureML, I presented different scenarios. In these scenarios I figured out, whether neural networks may or may not solve specific tasks. One scenario is presented here.
Scenario: Weather/temperature prediction for tomorrow
Neural networks are able to make predictions on the basis of what they have learned. This experiment shows whether this also applies to tomorrows temperature. The aim is that the experiment predicts the average temperature for tomorrow. As an input parameter the experiment gets the average temperature of today and the past 59 days.

The experiment is simply build in Azure Machine Learning Studio:
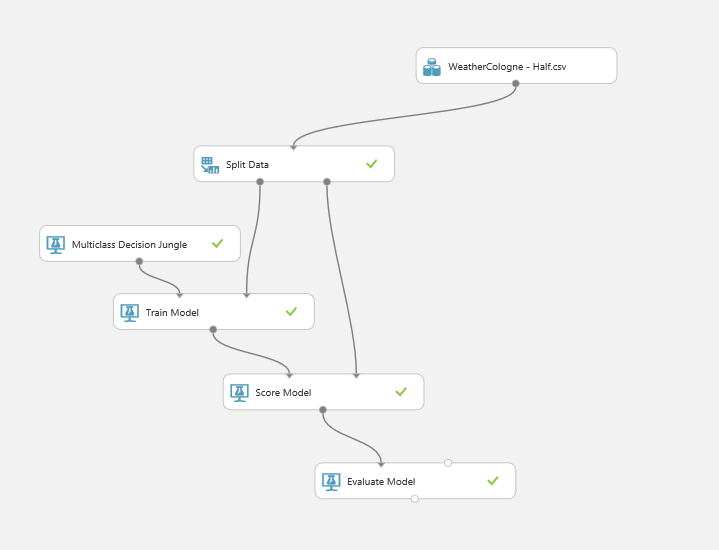
Data source and modelling
To enable the experiment to learn, it requires a large amount of data – the average temperatures in a chronological sequence. For Cologne I found these data and more on the web site of Klaus G. Rode: http://www.koelnwetter.de/home/archiv/jahre.html. From January 1st 2007, the average temperature has been recorded for each day. To simplify the experiment, I rounded up the temperatures. So over 3000 records for training are available.
The first record is complete on March 2nd 2007. The average temperature was 6°C on March 2nd 2007. On the day before it had been 10°C and 60 days earlier (on 1st January 2007) 7°C. The first records are as follows:
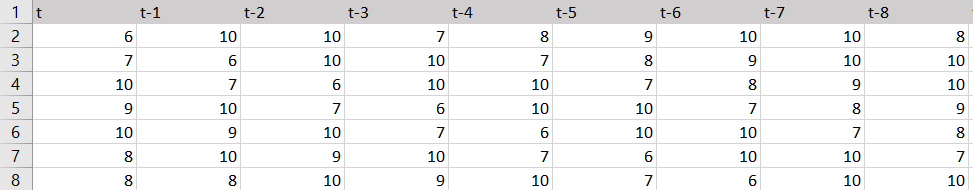
Accordingly as a CSV to import into AzureML:
|
1
2
3
4
5
6
7
8
9
10
11
12
13
14
15
16
17
|
t,"t-1","t-2","t-3","t-4","t-5","t-6","t-7","t-8","t-9","t-10","t-11","t-12","t-13","t-14","t-15","t-16","t-17","t-18","t-19","t-20","t-21","t-22","t-23","t-24","t-25","t-26","t-27","t-28","t-29","t-30","t-31","t-32","t-33","t-34","t-35","t-36","t-37","t-38","t-39","t-40","t-41","t-42","t-43","t-44","t-45","t-46","t-47","t-48","t-49","t-50","t-51","t-52","t-53","t-54","t-55","t-56","t-57","t-58","t-59","t-60"6,10,10,7,8,9,10,10,8,9,8,6,4,7,7,6,7,8,9,9,6,4,2,1,3,3,5,6,9,9,8,8,8,6,4,-2,-2,-2,-2,1,7,12,11,13,11,8,3,6,12,11,13,13,18,18,9,10,13,18,19,15,77,6,10,10,7,8,9,10,10,8,9,8,6,4,7,7,6,7,8,9,9,6,4,2,1,3,3,5,6,9,9,8,8,8,6,4,-2,-2,-2,-2,1,7,12,11,13,11,8,3,6,12,11,13,13,18,18,9,10,13,18,19,1510,7,6,10,10,7,8,9,10,10,8,9,8,6,4,7,7,6,7,8,9,9,6,4,2,1,3,3,5,6,9,9,8,8,8,6,4,-2,-2,-2,-2,1,7,12,11,13,11,8,3,6,12,11,13,13,18,18,9,10,13,18,199,10,7,6,10,10,7,8,9,10,10,8,9,8,6,4,7,7,6,7,8,9,9,6,4,2,1,3,3,5,6,9,9,8,8,8,6,4,-2,-2,-2,-2,1,7,12,11,13,11,8,3,6,12,11,13,13,18,18,9,10,13,1810,9,10,7,6,10,10,7,8,9,10,10,8,9,8,6,4,7,7,6,7,8,9,9,6,4,2,1,3,3,5,6,9,9,8,8,8,6,4,-2,-2,-2,-2,1,7,12,11,13,11,8,3,6,12,11,13,13,18,18,9,10,138,10,9,10,7,6,10,10,7,8,9,10,10,8,9,8,6,4,7,7,6,7,8,9,9,6,4,2,1,3,3,5,6,9,9,8,8,8,6,4,-2,-2,-2,-2,1,7,12,11,13,11,8,3,6,12,11,13,13,18,18,9,108,8,10,9,10,7,6,10,10,7,8,9,10,10,8,9,8,6,4,7,7,6,7,8,9,9,6,4,2,1,3,3,5,6,9,9,8,8,8,6,4,-2,-2,-2,-2,1,7,12,11,13,11,8,3,6,12,11,13,13,18,18,9… |
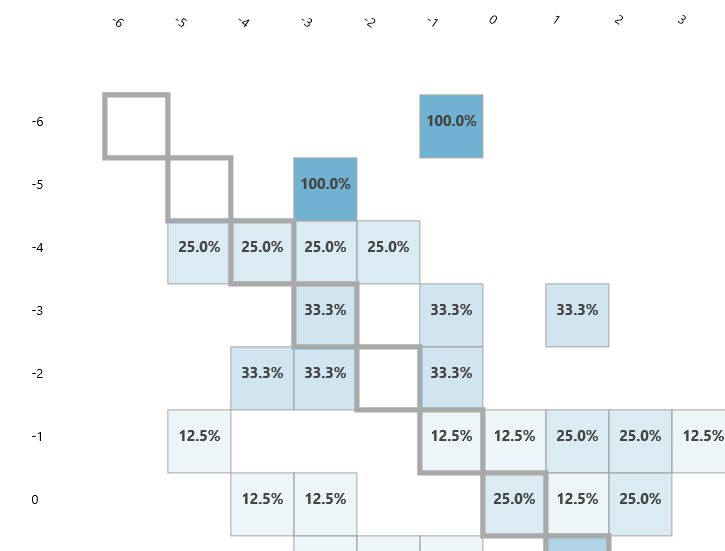
Confusion Matrix
The confusion matrix looks quite promising. If all values are 100% in diagonal, the prediction is logically perfect. Because the probabilities are close to the diagonal, I reach an approximate predictability apparently.
Results
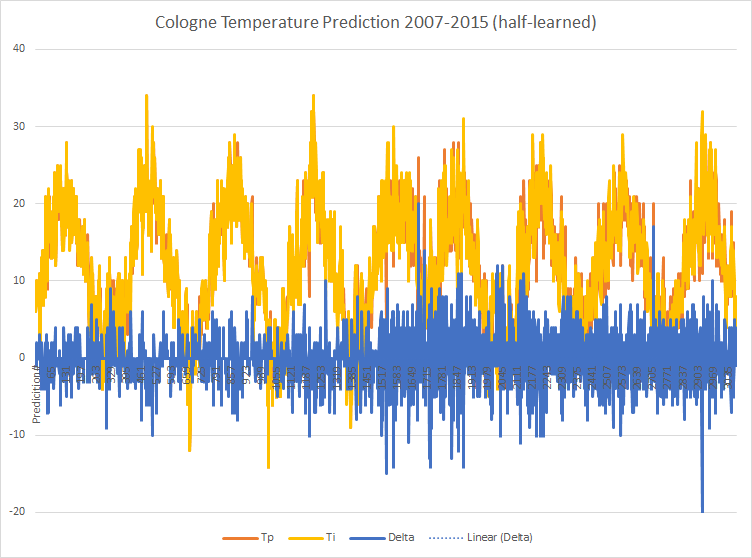
I used the semi-skilled model to predict the temperatures of the last 8 years (always based on the temperature of the previous 60 days). As the measured temperatures (Ti) are known, I calculated the delta to the predicted ones (Tp). P is the probability of the individual forecast.

You can see that the first predictions do not differ very much from the measured values. Over the entire period, the following picture emerges:
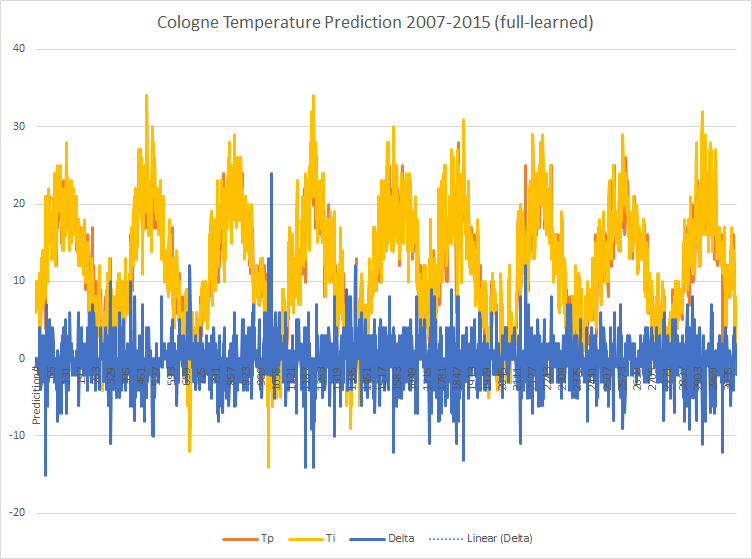
A clearer picture becomes visible by zooming in. Here is the visualization of records 2000-2138 (approximately in the year 2013):
Forecast and measured data seem to agree in many cases and lie close together. Only 6 times the measurement and the predicted value differed by 5°C.
Cross-check
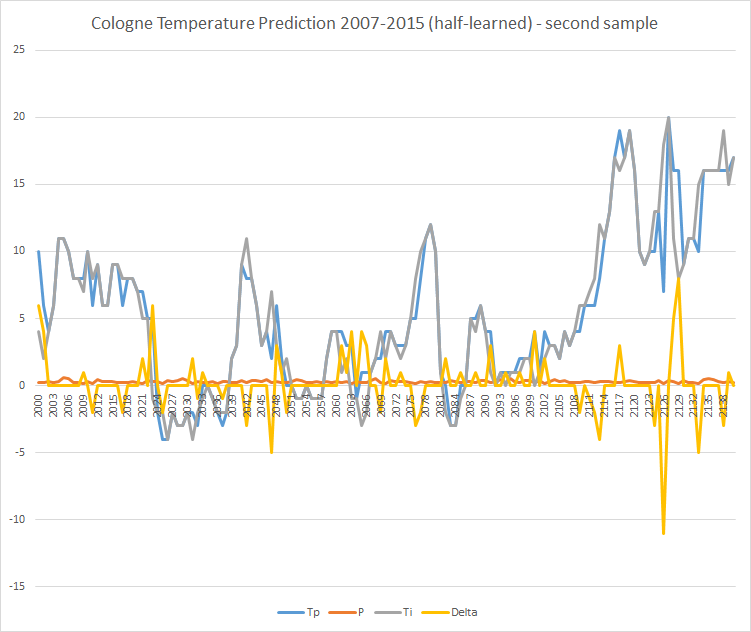
But can it be true that the average temperature can be predicted easily? The logic clearly says ‘no’ here. The experiment does not take into account winds, highs, lows, global weather conditions, etc. I repeated the experiment and predicted the period of more than 8 years again with only half of the data (2007-2012) and got the following results:
You can see that the predictions are less accurate in the second half. And indeed: a snippet of the second half is less accurate than in the “fully taught-in” model:
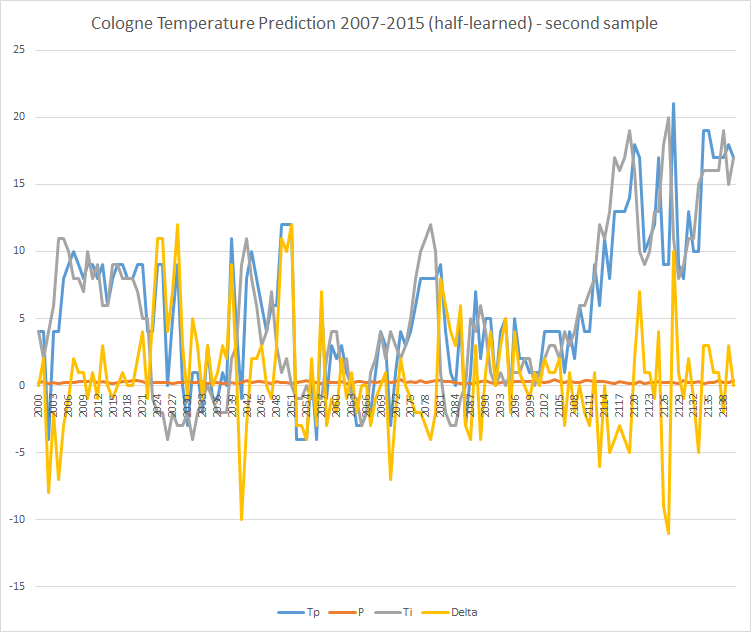
In the same period as above there are 26 deviations of more than 5°C.
Conclusion
What does that mean? It means that I have “overtaught” the model in the first case with the full data. The experiment has memorized the data and could make “good” predictions in the context of the test data. However, the predictions lose much of their quality when applied to the future. It is what it is. The experiment is not suitable for accurate predictions of tomorrows temperature. The results are rather comparable to the so-called “country sayings”. More important are the insights into the handling of the input data, their modeling and especially the interpretation and questioning of the results.